
Modern companies need to develop their business intelligence (BI) capabilities to get an edge over competitors and analyze historical records to make better decisions. Enterprises deploy AI tools to process information faster and extract accurate insights. However, making figures comprehensible to the staff is not an easy task. In this guide, we will consider how AI data visualization practices shape industries and enable personnel at all levels to read and interpret various inputs correctly to detect patterns.
What is AI Data Visualization?
The term refers to visualizations of data in the form of line and funnel charts, graphs, heat maps, diagrams, and scatter plots to illustrate relations between distinct sets of information, unveil trends, and facilitate judgment. These days, companies have to collect and process insights from multiple sources to understand how certain trends have been developing historically and make accurate predictions about future changes.
Traditional data visualization software relies on statistical models. Such programs cannot handle extensive datasets with high accuracy. This is why enterprises deploy advanced AI systems designed to process Big Data and create precise representations. AI software powered by LLMs and extensive neural networks can process data quickly, analyze facts, forecast future developments, and visualize results using interactive dashboards.
Benefits of AI Data Visualization
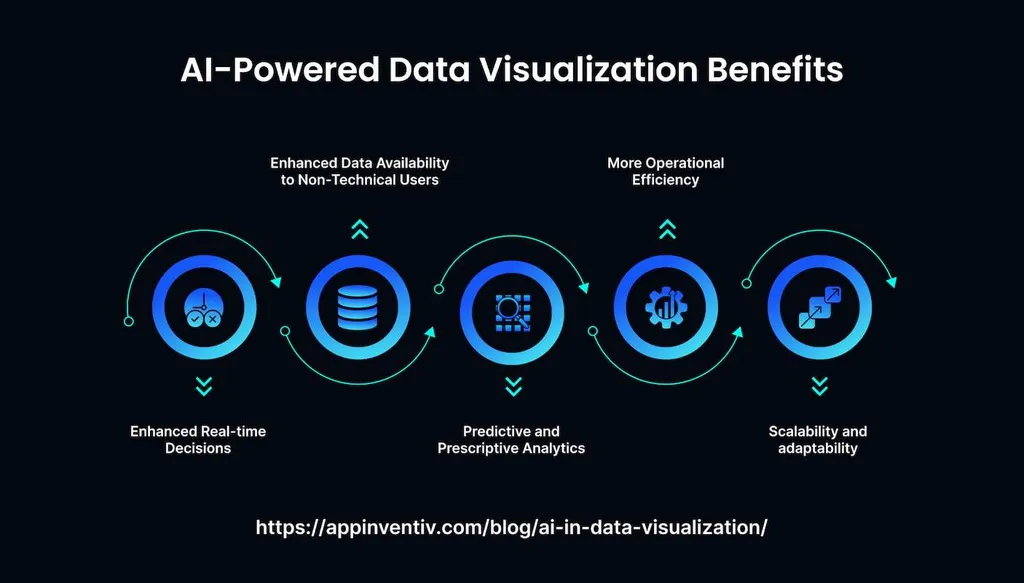
By learning how to collect, organize, and analyze information, organizations become more efficient and discover areas for improvement. There are several notable upsides to deploying AI tools to visualize the discovered insights:
- Intuitive functionality. Programs with AI features often have streamlined interfaces and navigation systems, making them suitable even for non-technical users. One can drag and drop files, customize charts, and organize information in different ways to make it more comprehensive.
- Integration of new sources. Pro-grade AI programs process data from a variety of sources. Companies deploy such tools to streamline workflows and make choices based on verified insights.
- Top-grade security. Developers continuously improve AI algorithms. They rely on tokenization, encryption, custom access controls, anonymization, and other practices to ensure that nobody will be able to compromise AI systems and get unauthorized access to customers’ details.
- Automated data processing. One can deploy AI to clean and sort collected insights, improve their quality, fix mistakes, eliminate duplicates, and perform other routine tasks to make visualizations more accurate. The AI has extensive summarization capabilities and can process various source files, including those saved in video, audio, and image formats.
- Improved analytical capabilities. The AI analyzes the collected insights about customer behavior, buying trends, and various issues within a fraction of a second and provides comprehensive reports.
- Streamlined decision-making. The use of AI-driven data analysis tools enables one to quickly convert complex insights into well-organized knowledge bases and leverage them to achieve sustainable business growth. AI programs process incoming information 24/7 and update existing databases in real time.
- Advanced customization. Employees can specify the chart types they would like to use and choose the stats and insights they want to visualize. They should be able to personalize the interfaces and layouts of the software they use to streamline their workflows.
- Collaboration tools. After creating visualizations, staff members can share them with their colleagues.
AI algorithms allow professionals to enjoy augmented creativity, solve their tasks faster, and discover how to make their routines more efficient. An extensive choice of visualization options enables personnel to work on projects creatively and optimize resource usage.
Why Use AI Data Visualization
As enterprises began implementing AI solutions and integrating them into their systems, the number of applications for this technology increased. Across many industries, companies rely on automated data processing and visualization to perform the following tasks:
- Predicting trend development. AI software has well-developed reasoning capabilities. It facilitates modeling changes in a certain situation and building hypotheses regarding the future of an industry. AI tools unveil hidden relationships between patterns and visualize them, enabling employees to adjust their strategies and improve the products they are working on.
- Pre-processing datasets. The AI enables specialists to organize information before visualizing it. Staff use such tools to discover insights using certain criteria, convert files into other formats, perform initial assessments of datasets, delete duplicates, and perform other tasks to streamline the processing of collected facts.
- Chart recommendation. Top-level AI systems come with built-in analytics tools. Due to their advanced BI capabilities, they can suggest the most suitable chart type to help a user visualize trends and extract valuable insights.
- Dashboard creation. While many teams use traditional visualization software that allows them to create visualizations, AI makes this process more efficient. When using a BI dashboard, one can specify their requirements using text prompts. For instance, they may ask the AI to compare the productivity of separate teams or perform other requests.
In addition, AI can flag potentially unfavorable developments and notify employees about the problems that should be solved. Visualizations facilitate noticing irregularities and discovering the most efficient ways of solving an issue.
AI predicts how a situation can develop if certain conditions are met. Predictive analytics tools are trained to foresee the most likely changes, assess risk factors, predict client behavior, forecast revenue change, and solve other tasks.
Companies implement AI to make data easier to understand and come to conclusions based on an in-depth understanding of the situation within their industries. They rely on machine learning to streamline chart creation and render informative projections. LLMs trained on high-quality datasets improve the interpretation capabilities and usability of AI software. Besides, they support advanced customization and enable AI tools understand queries within a relevant context. NLP and GenAI technologies streamline sentiment analysis, summarization, anomaly detection, and problem-solving.
Challenges of Using AI in Data Visualization
When implementing AI solutions, businesses should consider the challenges they may encounter. Building such software from scratch requires a significant initial investment. Besides, one should integrate it with the existing IT infrastructure and solve compatibility issues. Training employees is also essential to ensure they will be able to use AI to its maximum capabilities. One should also consider how to deal with the following issues:
- Hallucinations. When AI systems are insufficiently transparent, it might be impossible to understand how they reached certain conclusions. As a result, they may provide wrong answers. By improving the quality of inputs, enterprises can typically solve this problem.
- Scalability. When one requires an AI system to process too much information quickly, they may need to wait for a while until the insights are visualized. Many programs freeze and fail to scale their performance.
- Ethical issues. Firms must adhere to the current privacy laws and implement strict security mechanisms to win the trust of stakeholders.
Besides, human oversight may still be necessary even when the main workflows have been automated. AI visualization tools facilitate information processing, making predictions, detecting anomalies, and generating practical solutions.
AI Visualization Use Cases
AI data visualization has been successfully applied by firms from across many industries and sectors. It enables businesses and organizations to automate data processing. Here are the main areas where such practices are used:
- Financial analytics. AI tools permit one to analyze current market trends, estimate the probability of certain outcomes, and discover areas for improvement. Businesses use AI to handle risks, forecast demand, and simplify processes.
- Healthcare. The AI enables professionals to analyze patient history and choose suitable treatment options. Researchers use AI to interpret genomes and develop personalized treatment plans. Such advancements expedite biomedical research and allow health specialists to improve patient outcomes.
- Environmental protection. Modern cities use AI to maintain infrastructure on track, streamline traffic, and optimize energy consumption. AI visualizations enable specialists to understand the effects of climate change, analyze the threat of natural disasters, and make weather forecasts more accurate.
Across all spheres, AI helps companies and organizations improve data analysis quality and solve challenges more effectively.
How to Implement AI Data Visualization
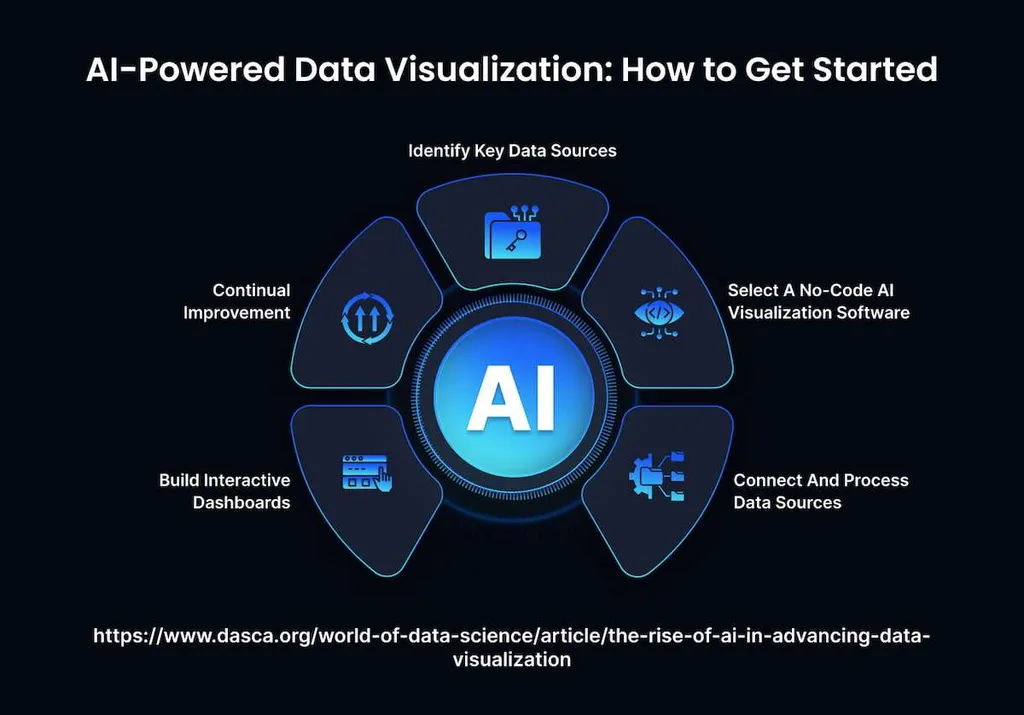
After choosing a suitable AI-powered solution, businesses should integrate it with their systems and knowledge bases as well as connect it to specific sources like spreadsheets. Integration with cloud platforms may also be necessary to streamline the cooperation between departments and facilitate information exchange. Then, ventures need to take the following steps: Start by exploring data. Use visual analytics tools and choose the insights you want to visualize.
Then, prepare datasets. It’s essential to solve the issues that may distort visualizations. Create charts and graphs. Try out various sorts of visualizations and customize them to your liking.
Using these best practices, firms augment the efficiency of AI tools and get better at understanding the information they use daily.
Final Thoughts
By deploying top-grade AI data visualization tools, one can better understand their customers, improve workflow efficiency, forecast possible downturns, predict future developments, and minimize expenses. However, building custom LLMs to power such solutions might be costly. This is why many ventures entrust third-party providers with this task. Metadialog develops enterprise-level AI models that facilitate collecting and processing extensive volumes of data. Contact our specialists and discover how to produce intuitive visualizations with the help of artificial intelligence.